The dashboard looks great and seems easy to navigate. Very helpful for the time poor and less data-skilled.
During London Data Week in July 2025, we launched the London VCSE dashboard, an interactive tool that brings together essential data about the city’s voluntary, community and social enterprise sector in one accessible place.

Why was it built?
Superhighways, leading the Datawise London programme, identified a key challenge: data about the VCSE sector is too fragmented. We realised that it is often spread across siloed directories, open datasets, or private databases.
Where data is available, it can be overly complex, difficult to navigate without specialist skills, or duplicated across multiple sources. A lack of consistent data standards also added to the issue.
To address this, our data team developed a platform on Power BI, designed to support better decision-making, improve collaboration, and increase visibility across the sector. We wanted to be able to answer questions like:
- How many organisations operate in London?
- Where are they based?
- How many people work or volunteer for them?
- How are they funded?
- How can we support them?
What does good look like?
We wanted to create...
A community owned and led data platform which brings together existing public data sets with VCSE owned data in an accessible and sustainable format so that different stakeholders can access, explore and visualise London’s VCSE sector.
The dashboard, improved with new functionality developed via co-design sessions, now brings together data in a way that is unified, customisable and sustainable. Built by the sector, for the sector, it will serve a wide range of stakeholders.
")
The launch events
Our two launch events, held on Tuesday 8th July and Thursday 10th July, were met with strong interest and engagement.
Across both sessions, we welcomed 119 attendees from a wide range of organisations, including frontline services, infrastructure bodies, local authorities, digital and data providers, funders, NHS representatives and more.
After demonstrating how to navigate the dashboard and walking through some example use cases, we invited participants to share their own.
Below are some of the ways they told us they plan to use it.
1. Strategic planning and funding decisions
Many attendees saw the dashboard as a valuable tool for identifying gaps in provision, informing funding strategies, and supporting more equitable resource distribution.
When reviewing grant applications, we aim to identify gaps in local provision and use this as an opportunity to fund other groups in Harrow.
We can stack our funding data on top of the dashboard to see where there are gaps or cross over.
2. Collaboration and partnership building
The dashboard is already being seen as a connector, helping organisations find potential partners and build stronger networks.
We often work with small charities who would like to use our system to collect data. When a few organisations can get together they can collaborate, for instance in a particular ward – so this is brilliant for understanding who orgs could work with.
It's useful to know other organisations working in our area. We are competing for funding, but it might also help us find ways to collaborate.
3. Local intelligence and community insight
Attendees highlighted how the dashboard helps them better understand the communities they serve and tailor their work to local contexts.
It helps to understand the communities we work with and be more strategic to partner with organisations. Helps us identify where there may be gaps in provision.
We can look at underserved boroughs – identify a need or a target group.
4. Evidence and advocacy
Several organisations plan to use the dashboard to strengthen funding bid and support advocacy efforts.
We can compare our membership data to make sure we're covering as many groups in Southwark as possible – and then use it to campaign and advocate on their behalf.
I think it will be a useful reference for reports etc., and I envisage sharing it a lot for partners to use.
5. Targeted promotion and outreach
Finally, attendees saw the dashboard as a great way to reach the right audiences.
It can be used to identify organisations who may not be aware of our funding, or who may support a cohort or group we are looking to invest in but who aren't aware of our support.
To work with organisations to encourage uptake of cancer screening programmes. Targeted work based on uptake numbers, using the map feature to link with areas of deprivation.
What was the response?
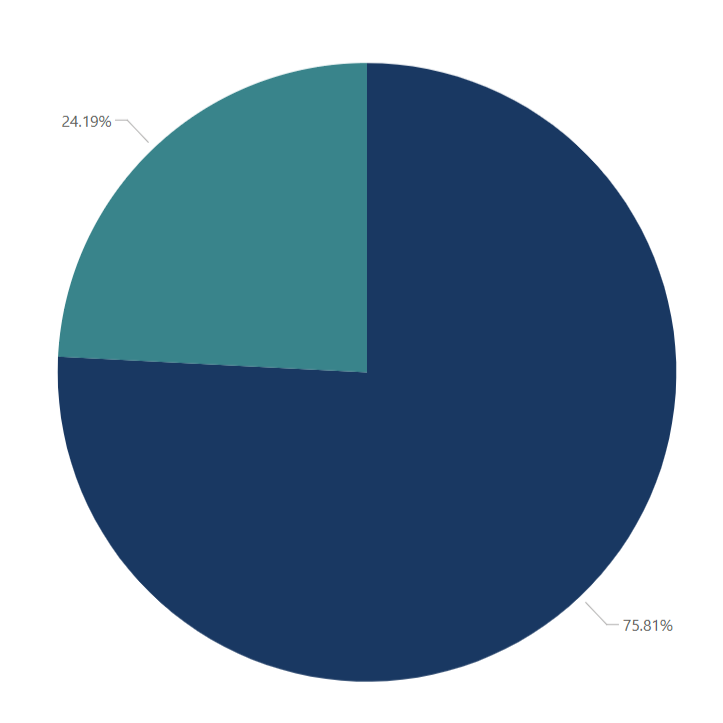
Of those who responded to our live polls, 76% said they would use the dashboard to inform their work, while the remaining 24% said they might.
We also received valuable feedback on how attendees would like to contribute to the platform’s development. Most respondents expressed interest in joining a collaborative group to help guide the dashboard’s ongoing improvement.
Others offered to share their data, participate in co-design sessions, align their work with ours, or even embed the dashboard on their own websites.

As the events came to a close, we received some lovely parting words from attendees:

Explore the dashboard
Couldn’t join us for the launch? Explore the dashboard yourself and check out the info pages for more details and help.
View the London VCSE dashboard
Monthly drop-in sessions
We’re inviting people who work in or with the VCSE sector to help add to this amazing tool by joining our monthly drop-in sessions. You can join our monthly drop-in sessions to contribute ideas, ask questions, or explore opportunities for collaboration. Everyone is welcome.
Click the link above and scroll down to see upcoming session dates.
Need a hand?
If you have any questions or would like further support, please get in touch with alicelinell@superhighways.org.uk.
We're seeking further funding
The development of the dashboard to date has been made possible through the Cornerstone Fund from City Bridge Foundation.
We are now seeking funding for the next phase of development, which will focus on incorporating community-owned datasets from infrastructure organisations and exploring the potential to expand the dashboard’s coverage across England and Wales.
If you are a funder interested in supporting this next stage, either independently or as part of a consortium, please get in touch!

Acknowledgements
We’re incredibly grateful to the Charity Commission for England and Wales, Companies House, 360Giving, David Kane (Find that Charity), and our funder City Bridge Foundation, for their ongoing support and invaluable contributions to this project.
A special thank you to Alice Linell and Veda Kowale from the Superhighways team. Their dedication, insight, and countless hours of work have been instrumental in bringing the VCSE dashboard to life.
Stay in touch
If you would like to receive news and updates about training, tech tips, resources and opportunities for small charities and community groups in London please sign up to our mailing list.