
The advice and information provided by Superhighways has given us access to a wider range of data and data tools with which to create our reports.
The training in pivot tables has improved and extended my data presentation skills. I’ve been recommending Superhighways to colleagues.
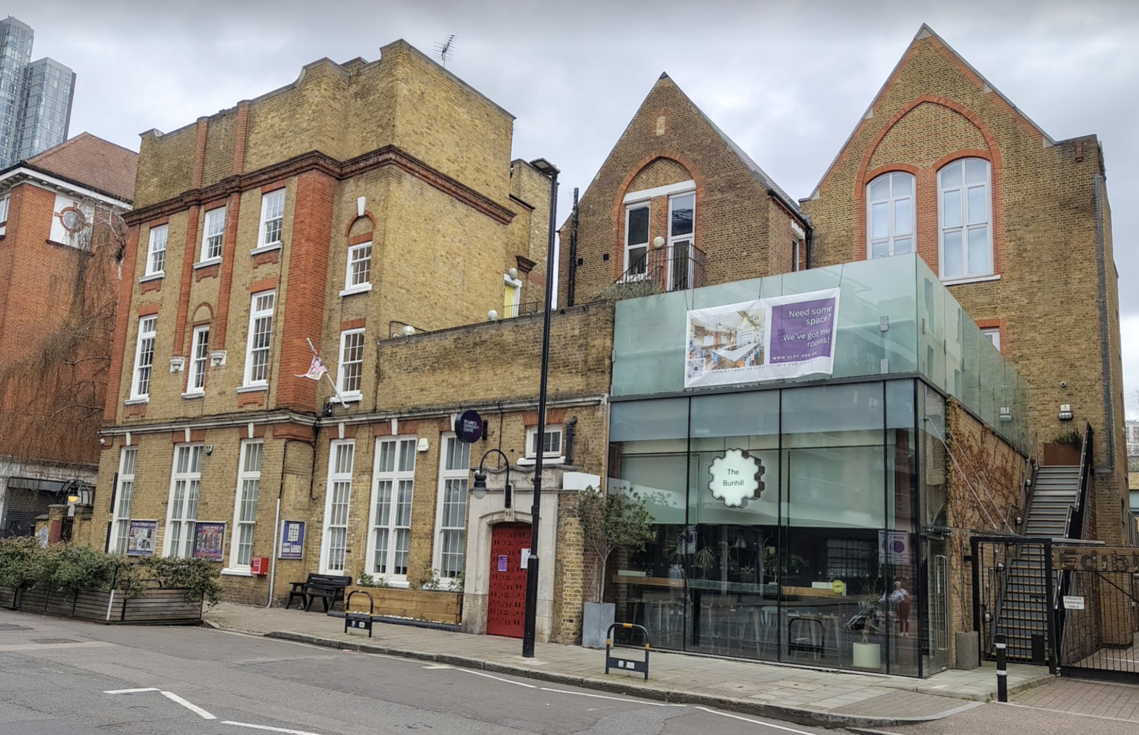
St Luke’s is a community centre and safe haven in south Islington, offering activities and services to those that need them at little or no cost.
Meet Sarah
In early 2026, we held a number of one-to-one sessions with Sarah Verrinder, Executive Assistant at St Luke's, to look at a some data tools.
Together, Sarah and Clare from Superhighways explored various data points using Census data and the Local Insight tool (such as demographic data, deprivation data, health data and more) for the Community Centre’s area of benefit.
This data was to be shared with their community through their annual report and also for use in funding applications. They also wanted to compare data for their area of benefit against data for Islington borough as a whole, London and England.
The digital challenge
St Luke’s Community Centre historically had access to the Local Insight tool through Islington Council’s membership, but this had since lapsed. It took quite a while for Islington to launch their own data tool to replace it and when they did, there was no training, and limited support.
Use of data tools in our organisation is regular but not frequent, so the opportunity to learn through use is limited, and not necessarily the best use of my time.
How Superhighways helped
In 2025 and 2026, Sarah joined webinars on 'Creating and exploring Census 2021 custom datasets', as well as 'Exploring data using the Local Insight platform' in January 2026. She also received resources relating to a Superhighways event, 'Exploring the new Indices of Deprivation data for London'.
The webinars were really useful, and I gained insight into alternative data tools, access to some Local Insight functionality, and learned how to prepare pivot tables.
However, where I’ve really benefitted is from the 1:1 follow up support with Clare, which has been fantastic; Clare really knows her stuff and communicates it well. She’s allowed me to take the learning at my own pace and has been very patient with me!
I wouldn’t claim to be an expert in pivot tables now, but am a lot more confident around them, and have used them to create a couple of small reports.
We created a custom area in the Local Insight tool and then overlayed various datasets to see, for example, deprivation data across their specific area of benefit, then downloaded the full datasets for Sarah to be able to compare across the various geographies she needed.
Running through how to set up pivot tables enabled Sarah to delve into Census data herself and create meaningful data visualisations from the large data exports.


Visit St Luke's Community Centre find out more about their services.
About Realities of Poverty

Realities of Poverty is a data literacy programme led by small charity digital, data and technology experts Superhighways and funded by Trust for London.
Look out for more data training on our training page.
Stay in touch
If you would like to receive news and updates about training, tech tips, resources and opportunities for small charities and community groups in London please sign up to our mailing list.